
Key Takeaways
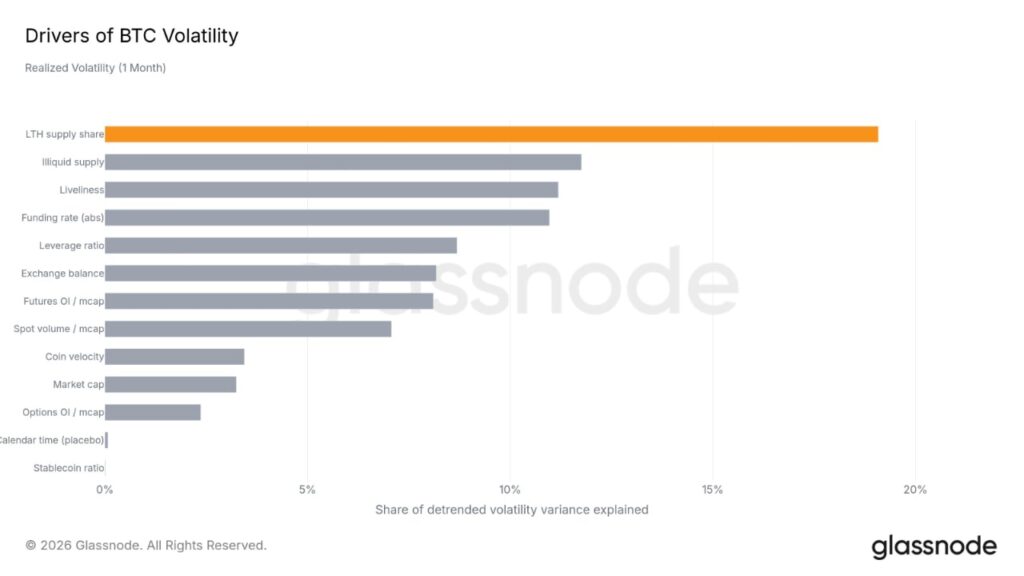
- Long-term holder supply explains nearly 19% of volatility variance.
- Illiquid supply and liveliness rank second and third in the analysis.
- Market capitalization accounts for approximately 3% of the variation.
Long-Term Holder Supply Leads Glassnode’s Analysis
Bitcoin was trading at $78,449.49 at the time of writing after falling below $79,000 following an unsuccessful attempt to remain above $80,000. Despite these short-term movements, Glassnode examined one-month realized volatility, which measures price fluctuations over the preceding month, in a Sept. 8 post on X.
The analytics firm wrote:
“BTC volatility is currently historically low.”
Glassnode compared 13 variables according to how much of bitcoin’s detrended volatility variance each explained. Detrending removes the longer-term statistical direction of the data, allowing shorter-term relationships to emerge. Long-term holder supply led at nearly 19%, followed by illiquid supply at approximately 12% and liveliness, a measure of older-coin spending activity, at about 11%.
Holder Concentration Shapes Trading Conditions
Market capitalization ranked near the bottom of Glassnode’s comparison, explaining slightly more than 3% of the variation. Coin velocity, which measures onchain transaction volume relative to market capitalization, produced a similar result. Spot volume explained about 7%, while leverage, exchange balances, and futures open interest registered between approximately 8% and 9%. Bitcoin’s longer-term volatility decline is also evident in comparisons with traditional asset classes.
Glassnode generally classifies coins held for at least 155 days as long-term holder supply. The cohort set another all-time high on July 21, extending a series of records after reaching approximately 16.64 million BTC, or about 83% of circulating supply, in June.
Renewed accumulation by long-term holders can reduce the amount of BTC available for active trading. The cohort has absorbed coins distributed by other market participants, shifting more supply toward holders statistically less likely to spend it in the short term.
Low Volatility Creates Two-Sided Trading Risk
For traders, the findings carry risk-management implications rather than a directional signal. A smaller liquid supply can moderate price movements while demand remains balanced, but it can also magnify price movements when demand changes sharply or dormant coins return to circulation. Funding rates, leverage, and futures positioning could then amplify the adjustment.
Periods of unusually low volatility have preceded significant bitcoin price advances in earlier cycles, though the pattern has not produced a dependable forecast. Fidelity Digital Assets examined bitcoin’s volatility history and classified those relationships as correlations rather than proof of causation. The current reading therefore describes recent price behavior without determining bitcoin’s next direction.