
BTC USD is pushing high again, with analysts highlighting an emerging $90K retest on the cards. Yet, as Bitcoin price movements in 2025 continue to draw intense open interest from traders and investors alike. Yesterday’s Google Trends data underscores a spike in searches for Bitcoin price action and technical analysis, reflecting a demand for clear market insights.
Higher highs, and higher lows.
Keep it simple.#Bitcoin pic.twitter.com/wv4fVE3BHY
— Jelle (@CryptoJelleNL) April 15, 2025
This article explores BTC’s latest chart patterns, critical support and resistance levels, and indicators like RSI and moving averages. Whether trading or investing, these technical insights offer a roadmap for the volatile crypto landscape.
Keeping it simple is actually an important part of technical analysis. Drawing many lines only creates confusion and makes deciding on entry much harder.
DISCOVER: 20+ Next Crypto to Explode in 2025
Bitcoin Price Analysis: Figuring Out Key Levels For BTC USD In April
The best way to trade is to have clearly defined levels that one monitors and, when the time comes, takes action. Let’s look at some charts and find out where key levels are.

(BTCUSD)
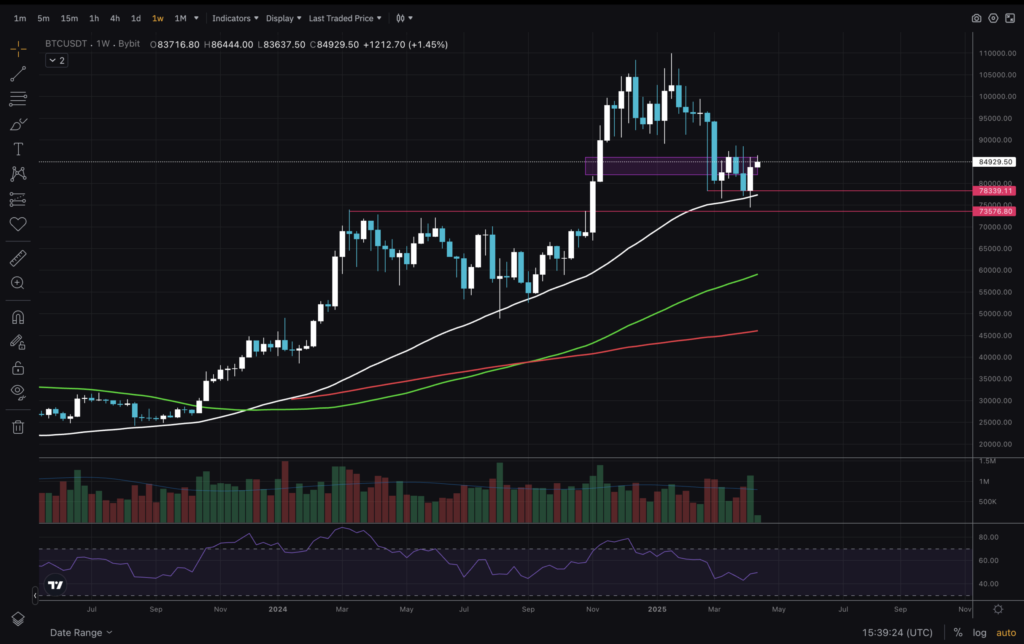
On the weekly timeframe, the Bitcoin price is still in an uptrend. Last week, MA50 was retested, and similarly to in the Summer of 2024, it bounced. So far, so good. There is also this first massive wick from the sell-off event in February, which is now filled. That’s evidence of market efficiency.
DISCOVER: 9+ Best High-Risk, High–Reward Crypto to Buy in April 2025
(BTCUSD)
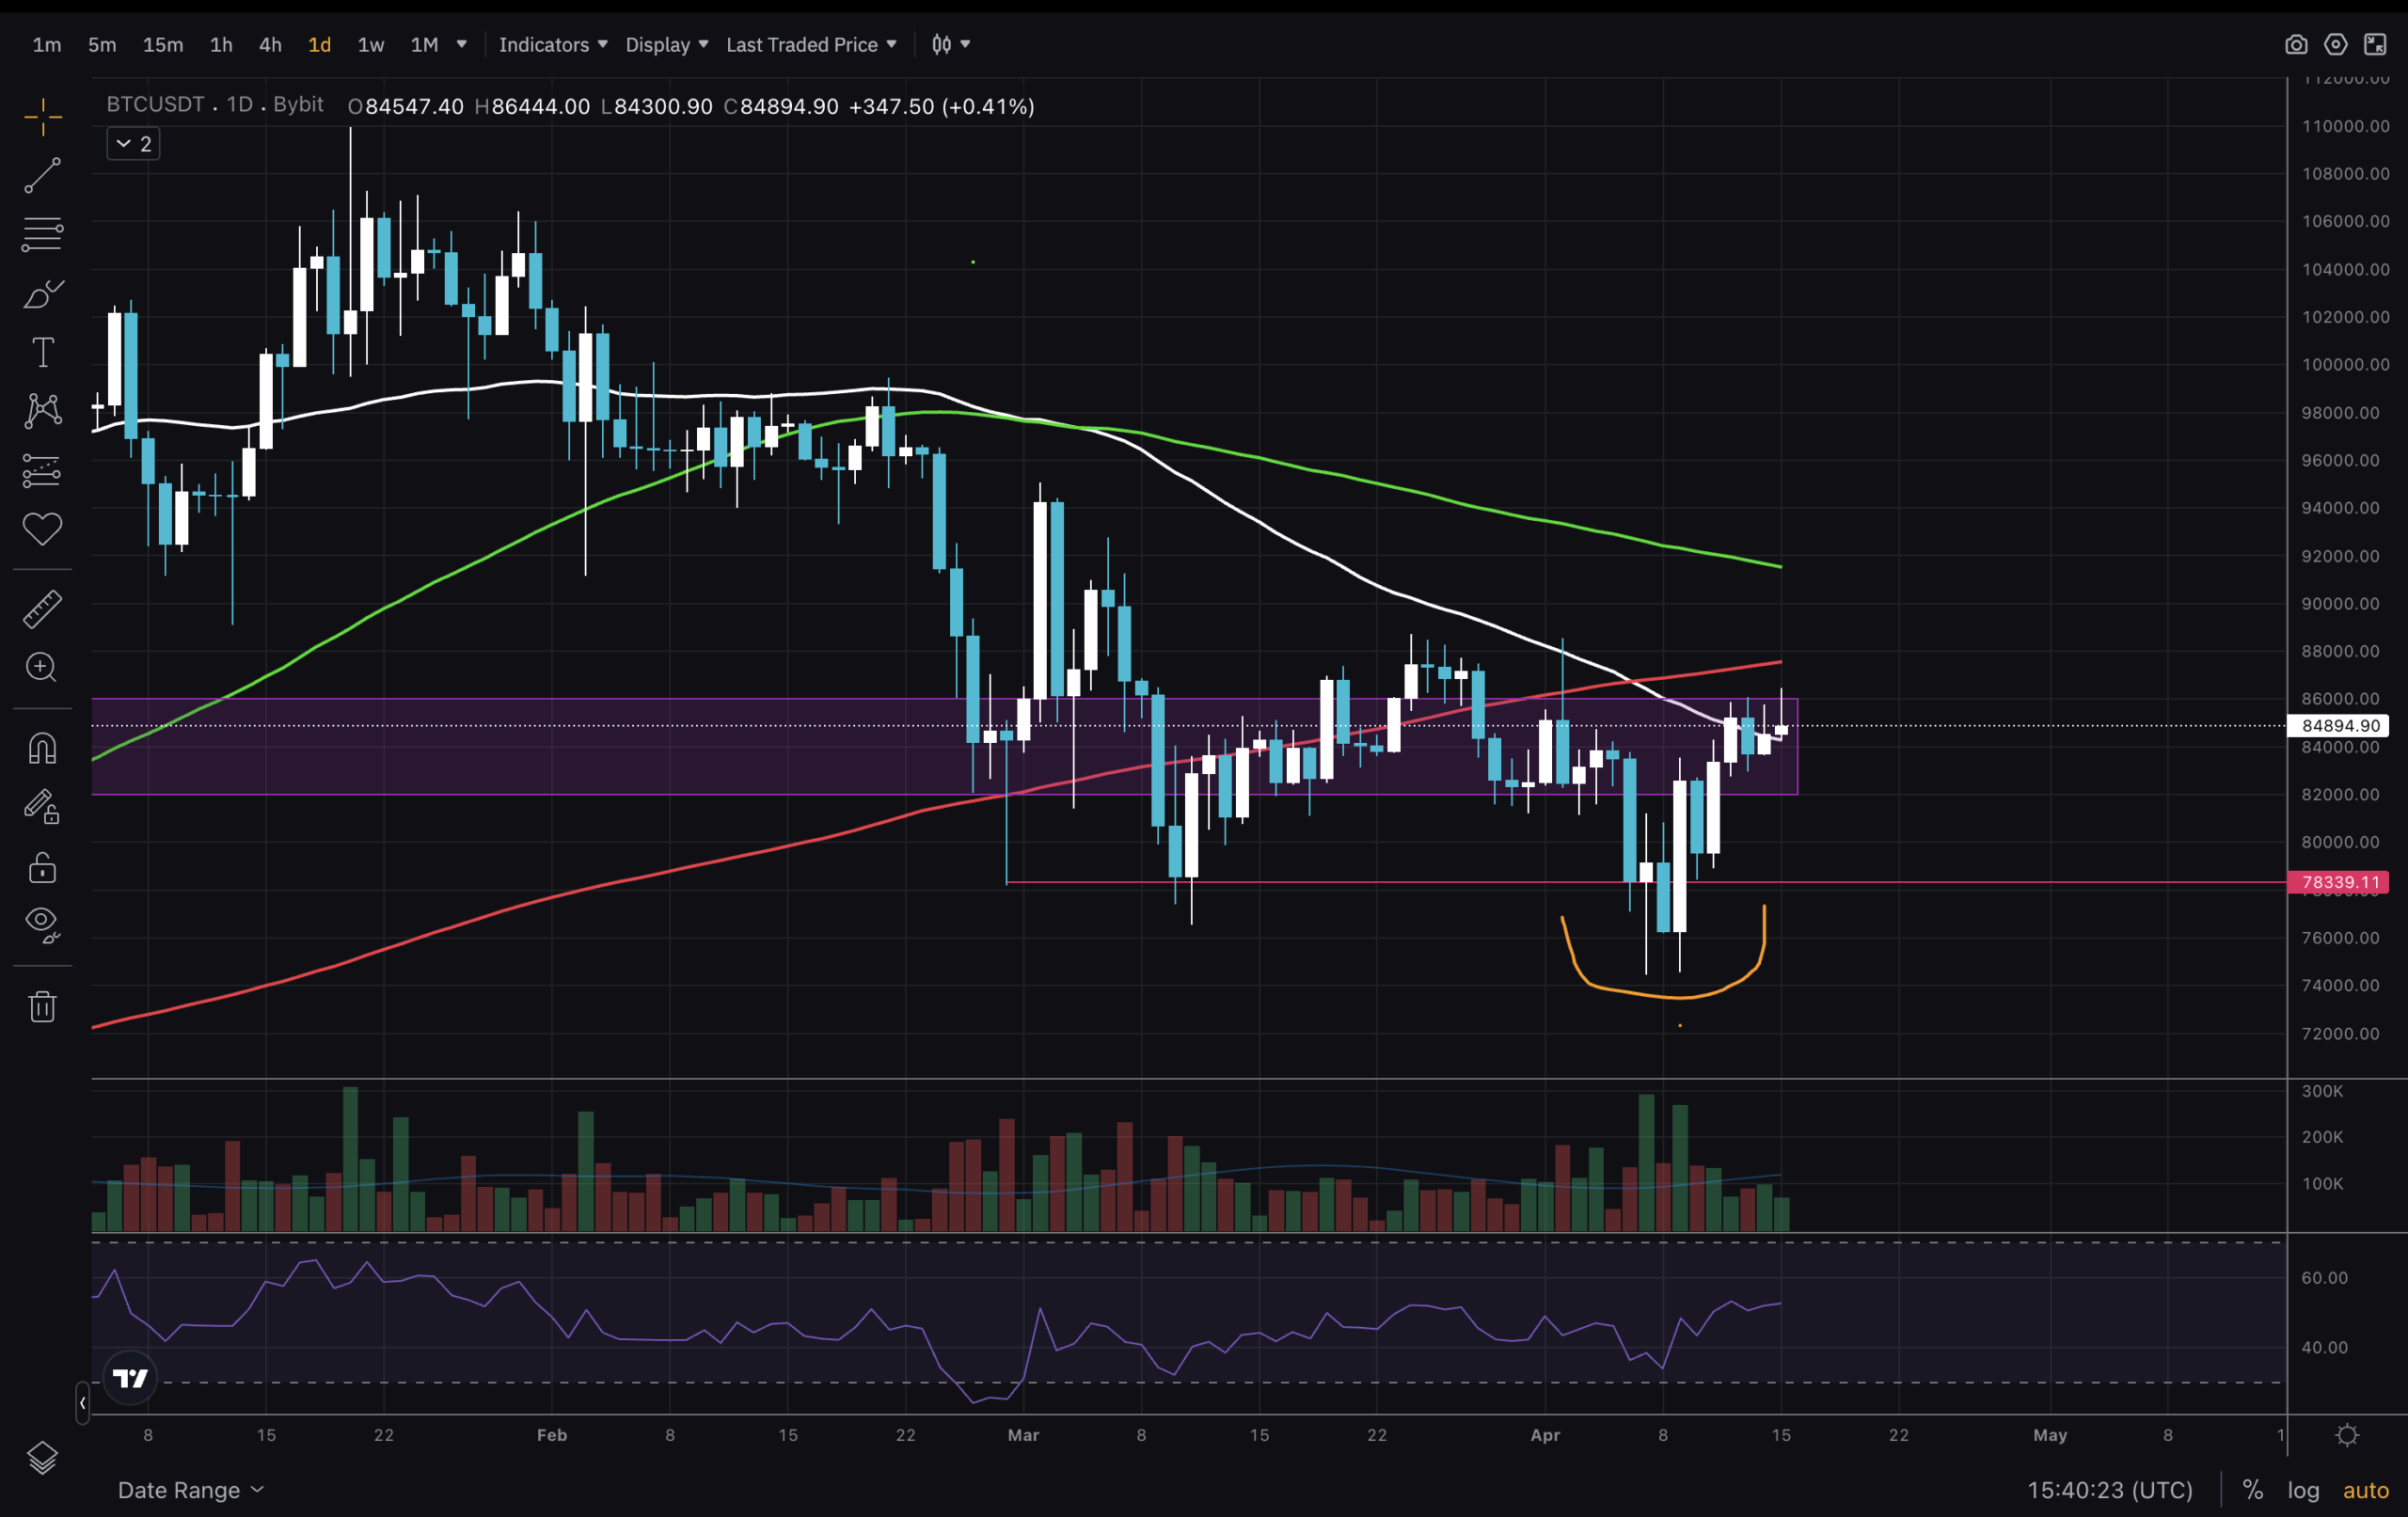
The 1-day chart shows a bit more detailed action. Where I’ve drawn the deviation below the $78339 line, a candle contesting for bullish engulfing formed. It was not a higher close than the blue one that touched the key level, but it had a higher volume and a larger body!
MA50 caught up now, and the BTC USD price has been in and out of the key box identified in my article dating Dec 2024. Eventually, I expect the Moving Averages to gather and start trending up as the price breaks the market structure and the bull run continues.
(BTCUSD)
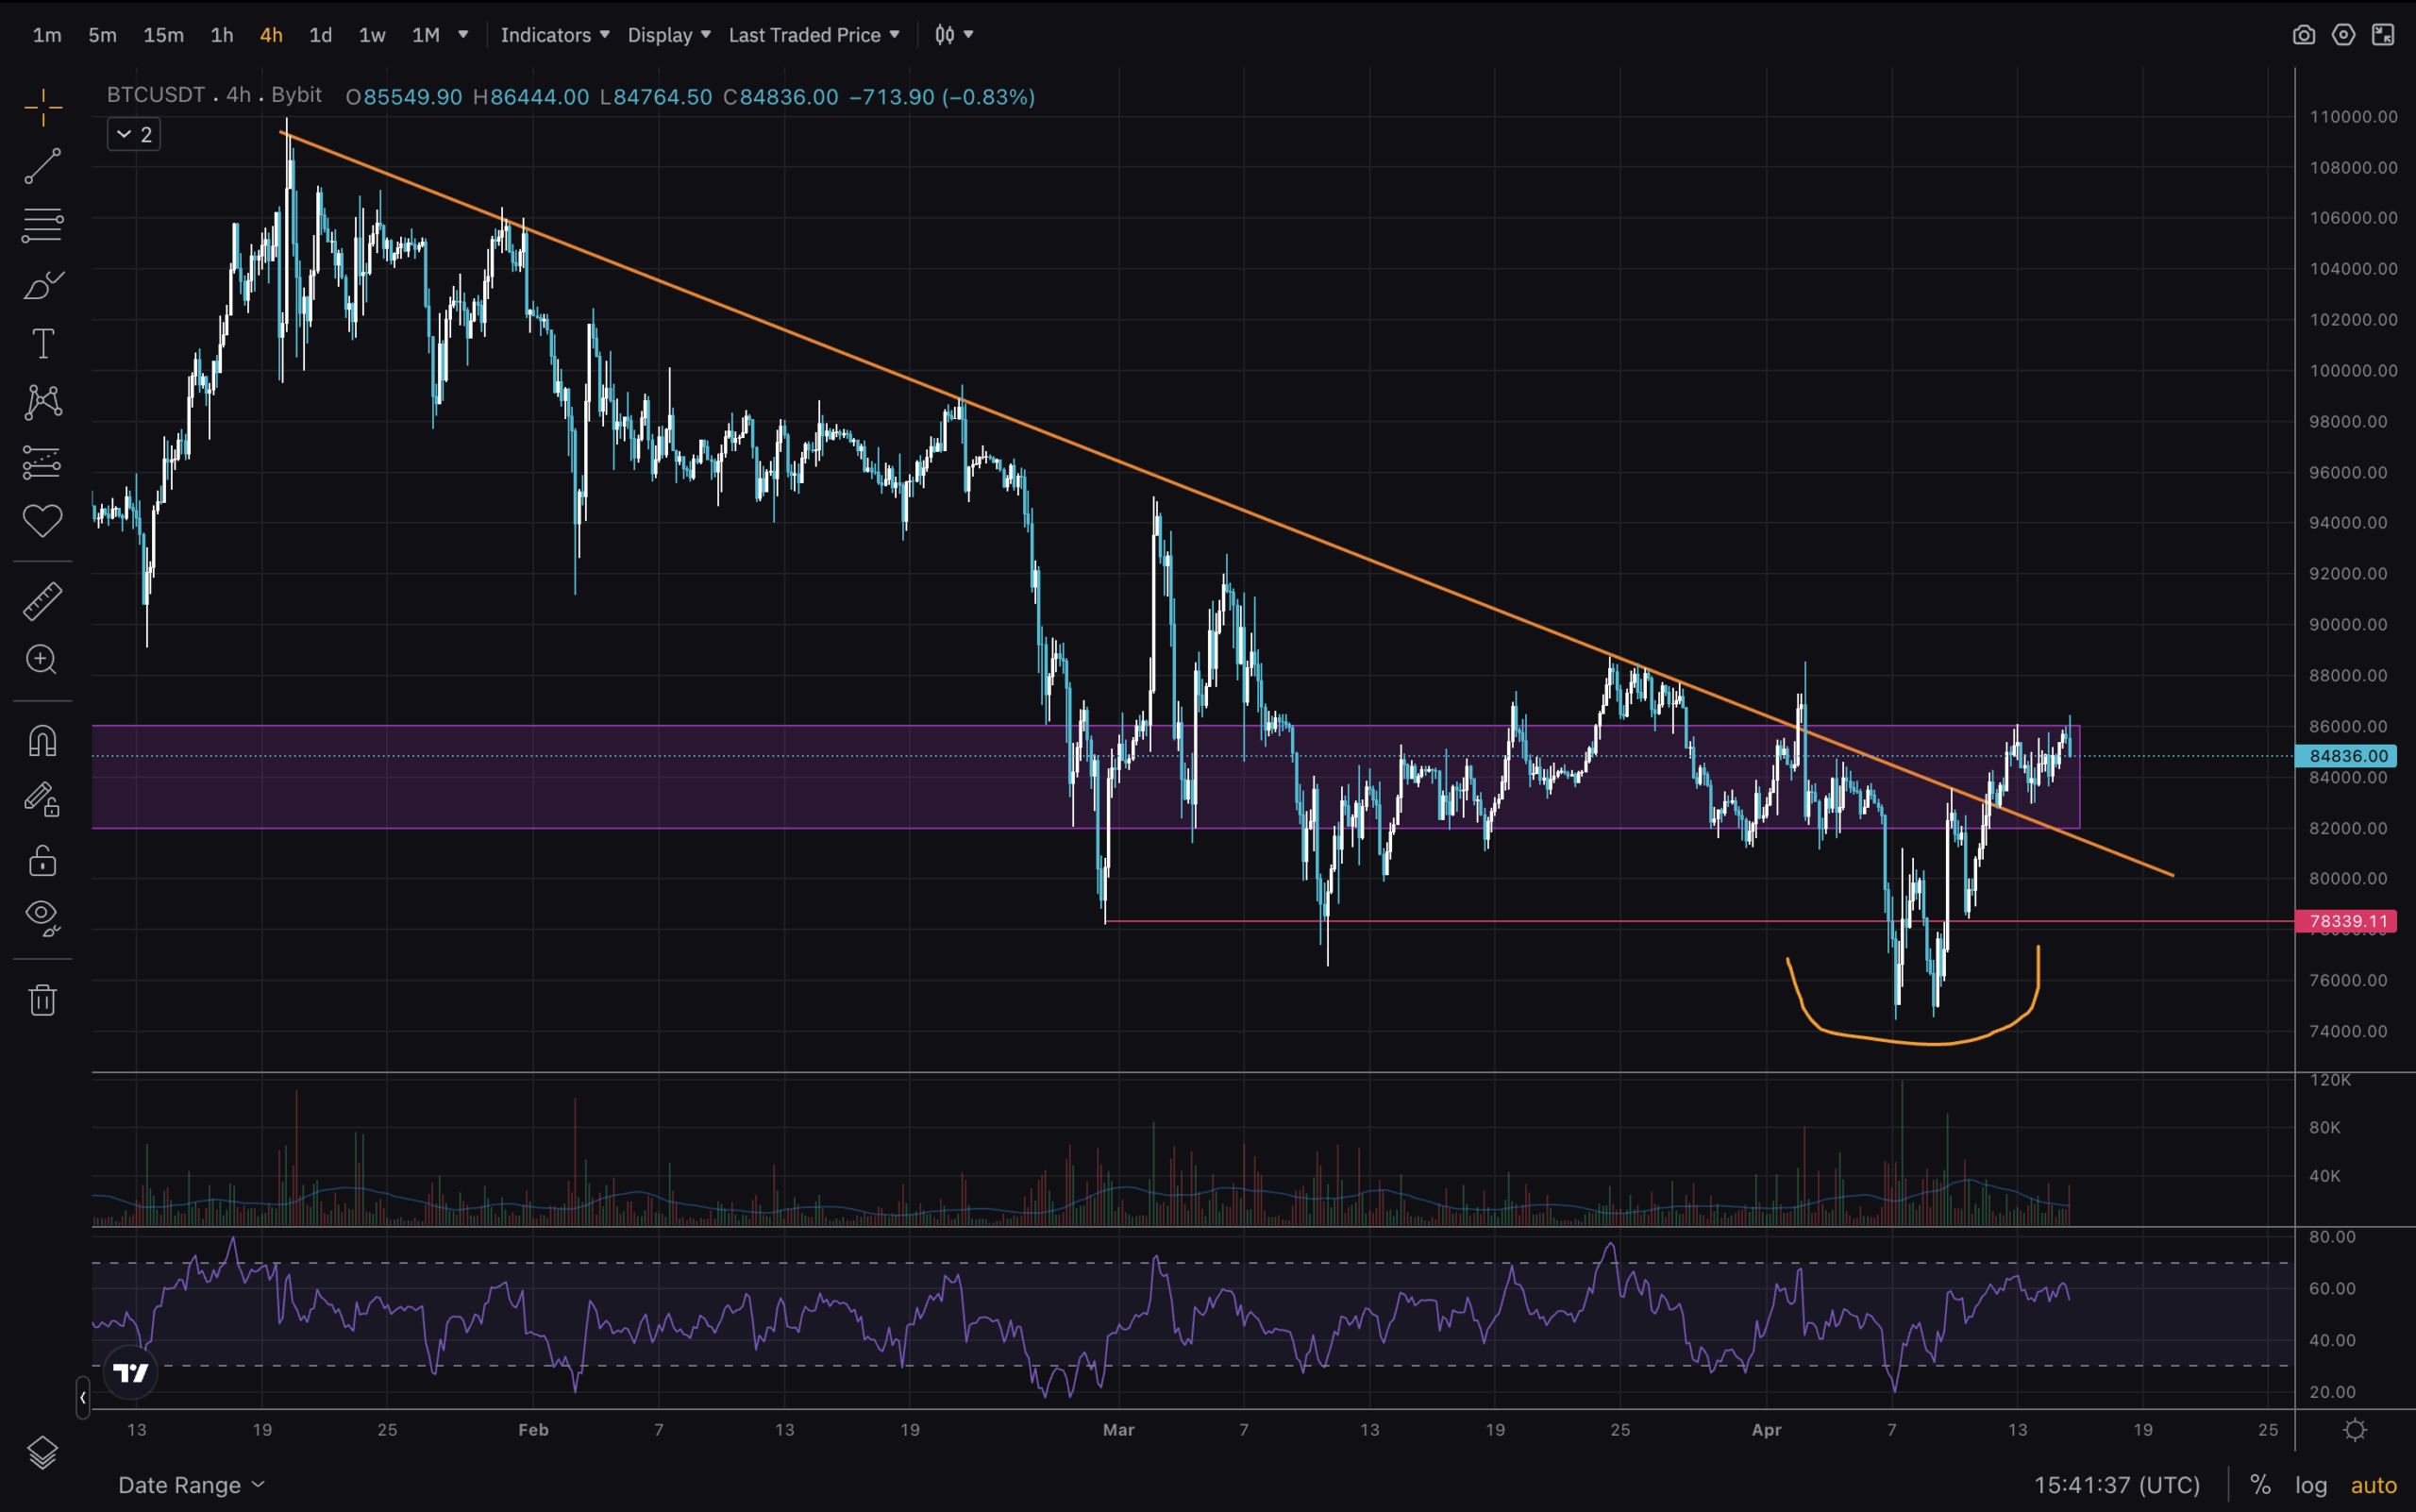
Finally, a quick look at the 4H – lower timeframe where we can identify entries. As well as early signs of trend reversal.
For the first time in forever (it seems, haha), we have broken above the 3-month-long bearish trendline. Good entry points were the test of the red line or the bullish divergence of the double bottom that formed during the deviation.
Meanwhile, the RSI looks like it needs to cool down a bit. Now, traders need to focus on the following possible scenarios for good entries:
1. A retest of the trend line.
2. Break above $86,000 and entry on retest
3. Not desired, but a potential retest of $78,000.
Stay safe out there!
DISCOVER: The 12+ Hottest Crypto Presales to Buy Right Now
Join The 99Bitcoins News Discord Here For The Latest Market Updates
The post BTC USD Shoots High as Bitcoin Price Analysis Reveals New Technical Insights appeared first on 99Bitcoins.