

Ethereum has continued its steady climb, currently trading near $2,600 after bouncing off the $2,220 demand zone in late June. The asset is now testing a strong supply area while maintaining its structure, suggesting bullish momentum is still in play. Yet, caution is warranted near the current highs.
Technical Analysis
By ShayanMarkets
The Daily Chart
ETH is currently hovering near $2,600 mark as the daily chart shows, after rebounding strongly from the $2,220 demand zone earlier. The price has managed to reclaim the 200-day moving average, located around the $2,400 mark, and is trading slightly above it, a key sign of medium-term strength.
Previously, the recent rally stalled near $2,800, where ETH ran a clear liquidity hunt before sharply reversing, forming a short-term lower high. Now, the asset is once again consolidating below the key $2,800 supply zone, trying to break through finally. As long as ETH holds above the 100 and 200 moving averages and doesn’t break below $2,400, the structure remains bullish.
Moreover, momentum is gradually building, but a clean daily close above $2,700 is still needed for confirmation. The RSI is holding around 57–60, reflecting moderate bullish momentum without signs of exhaustion. If the current consolidation resolves to the upside, ETH could revisit the $2,880 highs and possibly challenge the $3,000 zone. However, failure to break above could result in a rejection back toward the $2,400 support range.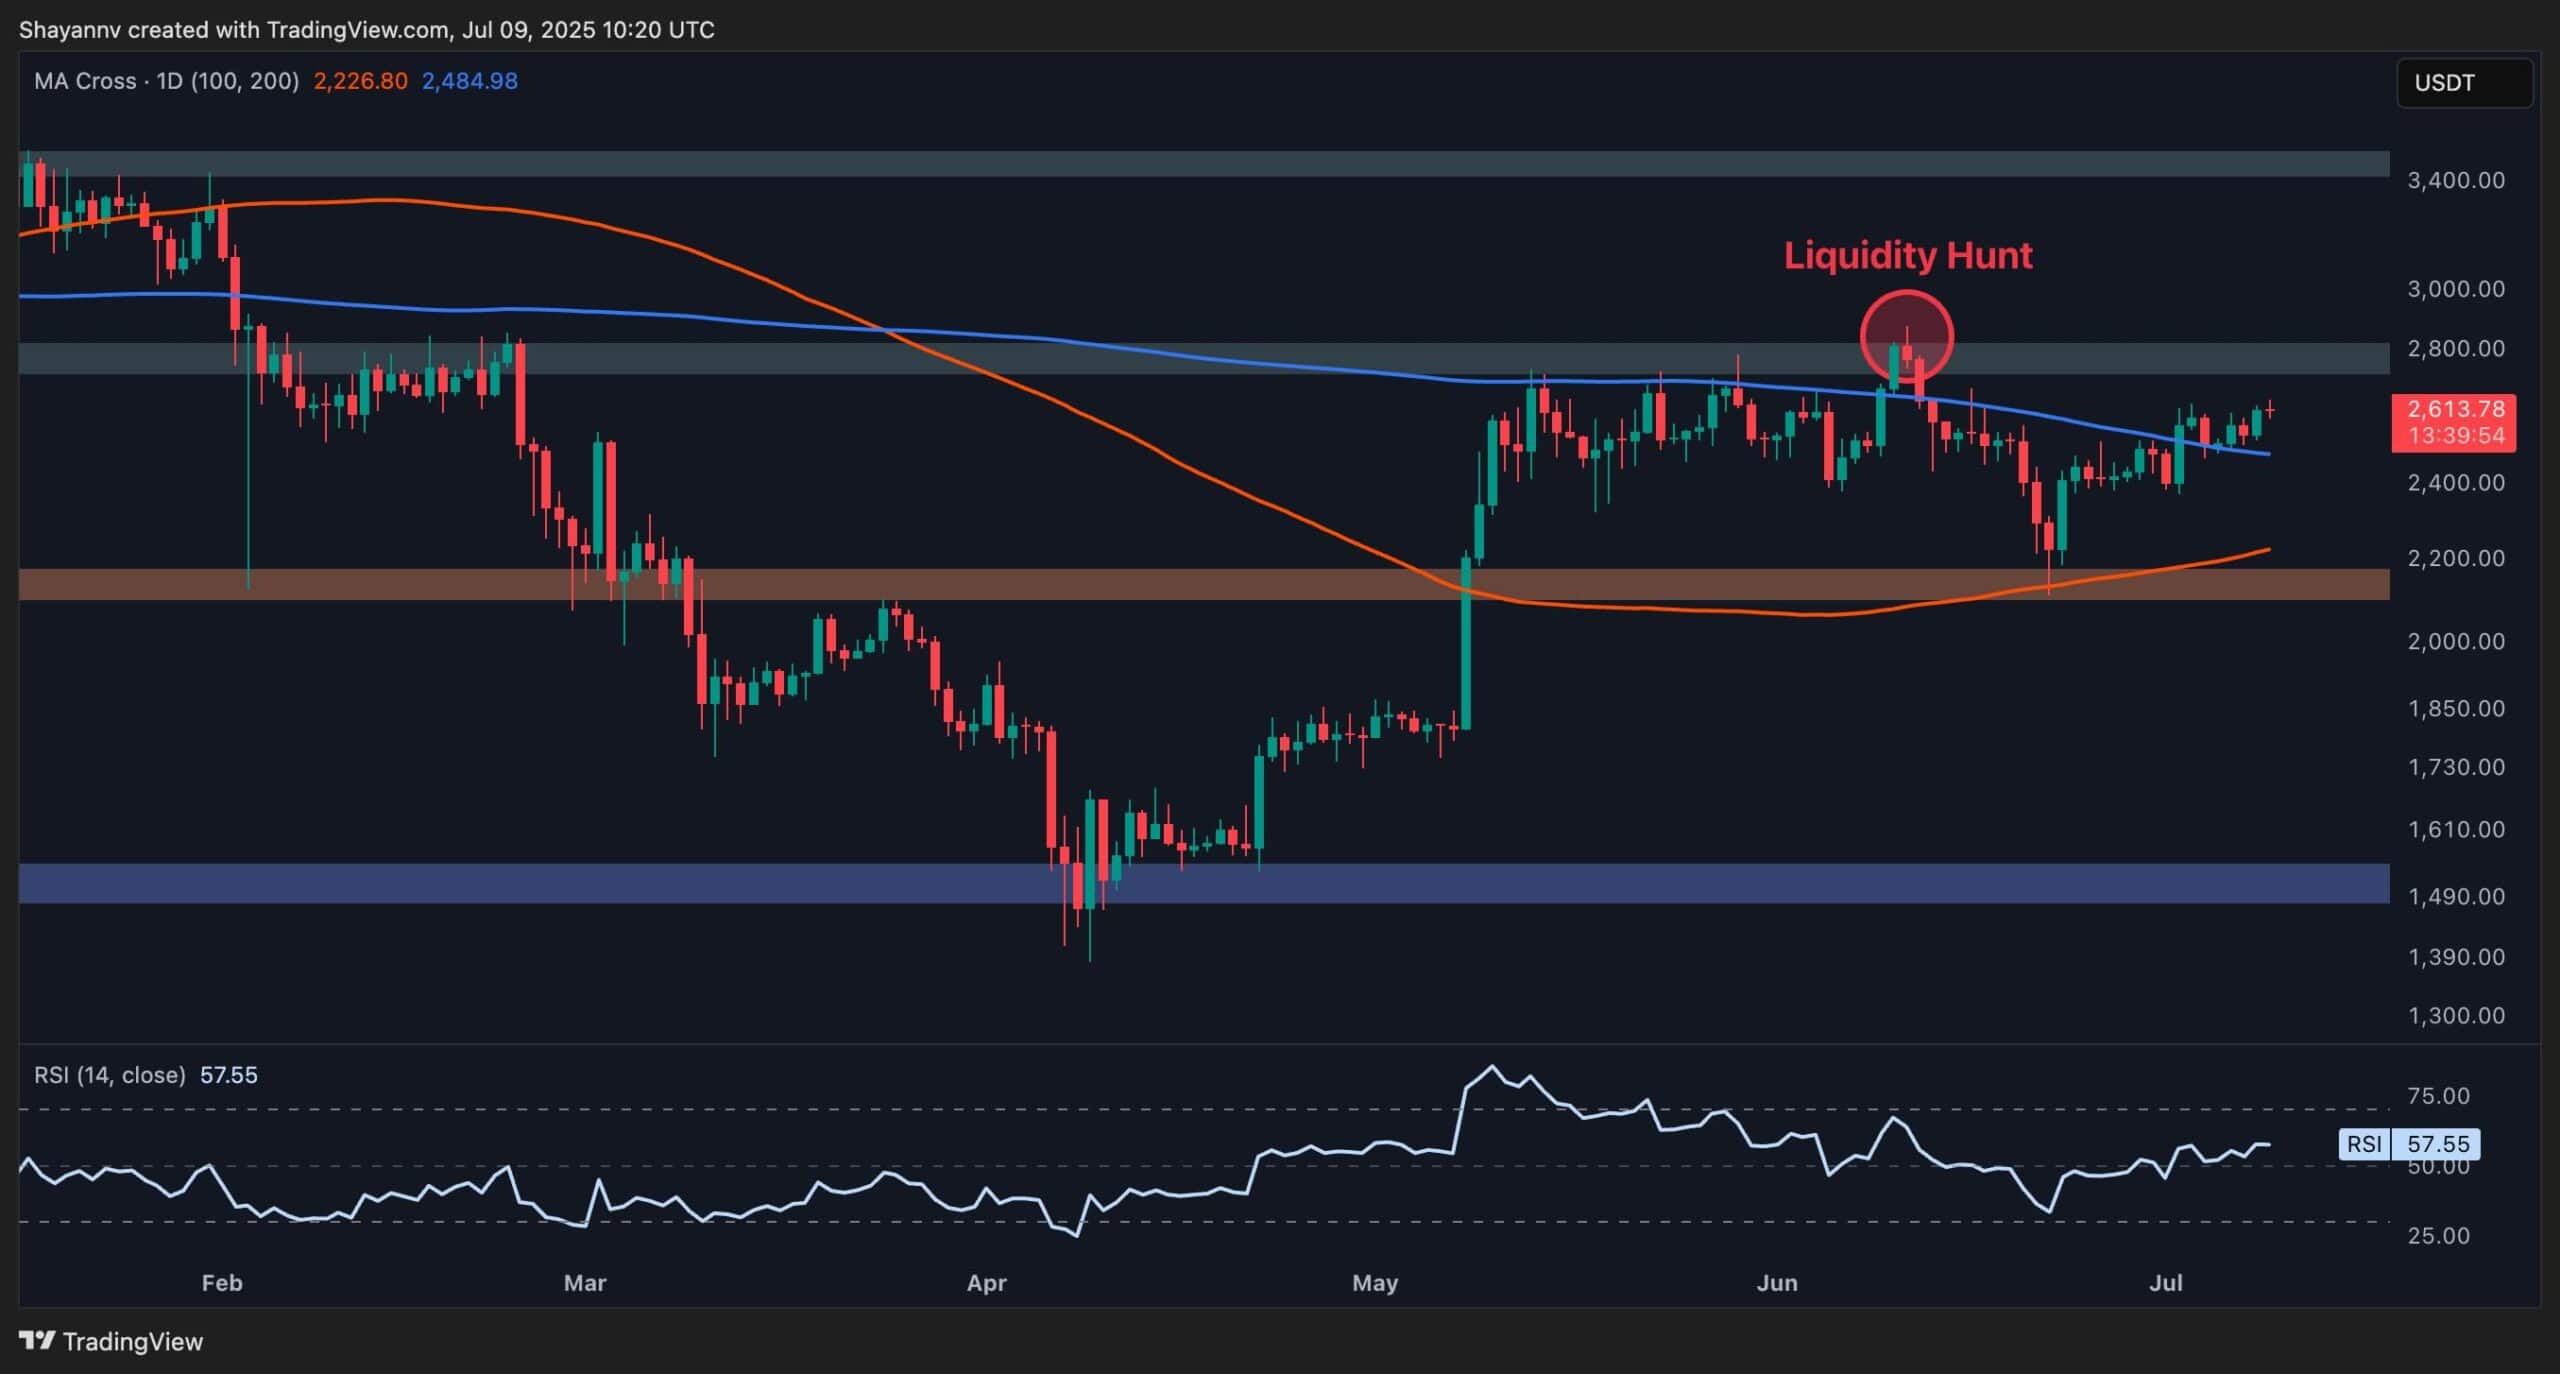
The 4-Hour Chart
On the 4-hour chart, ETH is forming a rising wedge just below the bearish order block formed around the $2,700 mark, which makes this a high-stakes consolidation. Price has tapped into the order block and is pressing against the wedge’s upper boundary. The 4H RSI is also near 61, showing bullish momentum, but with rising wedge formations, a breakdown is always a risk if bulls can’t push through resistance.
The key intraday level to watch is the $2,500–$2,550 region, which aligns with the recent low and the lower boundary of the wedge. If ETH breaks below this zone with strong volume, it could signal a drop toward the $2,300 liquidity pool and fair value gap. On the flip side, a clean breakout above $2,700 with increasing volume would invalidate the wedge breakdown scenario and open up a path toward the $2,900 high and even further.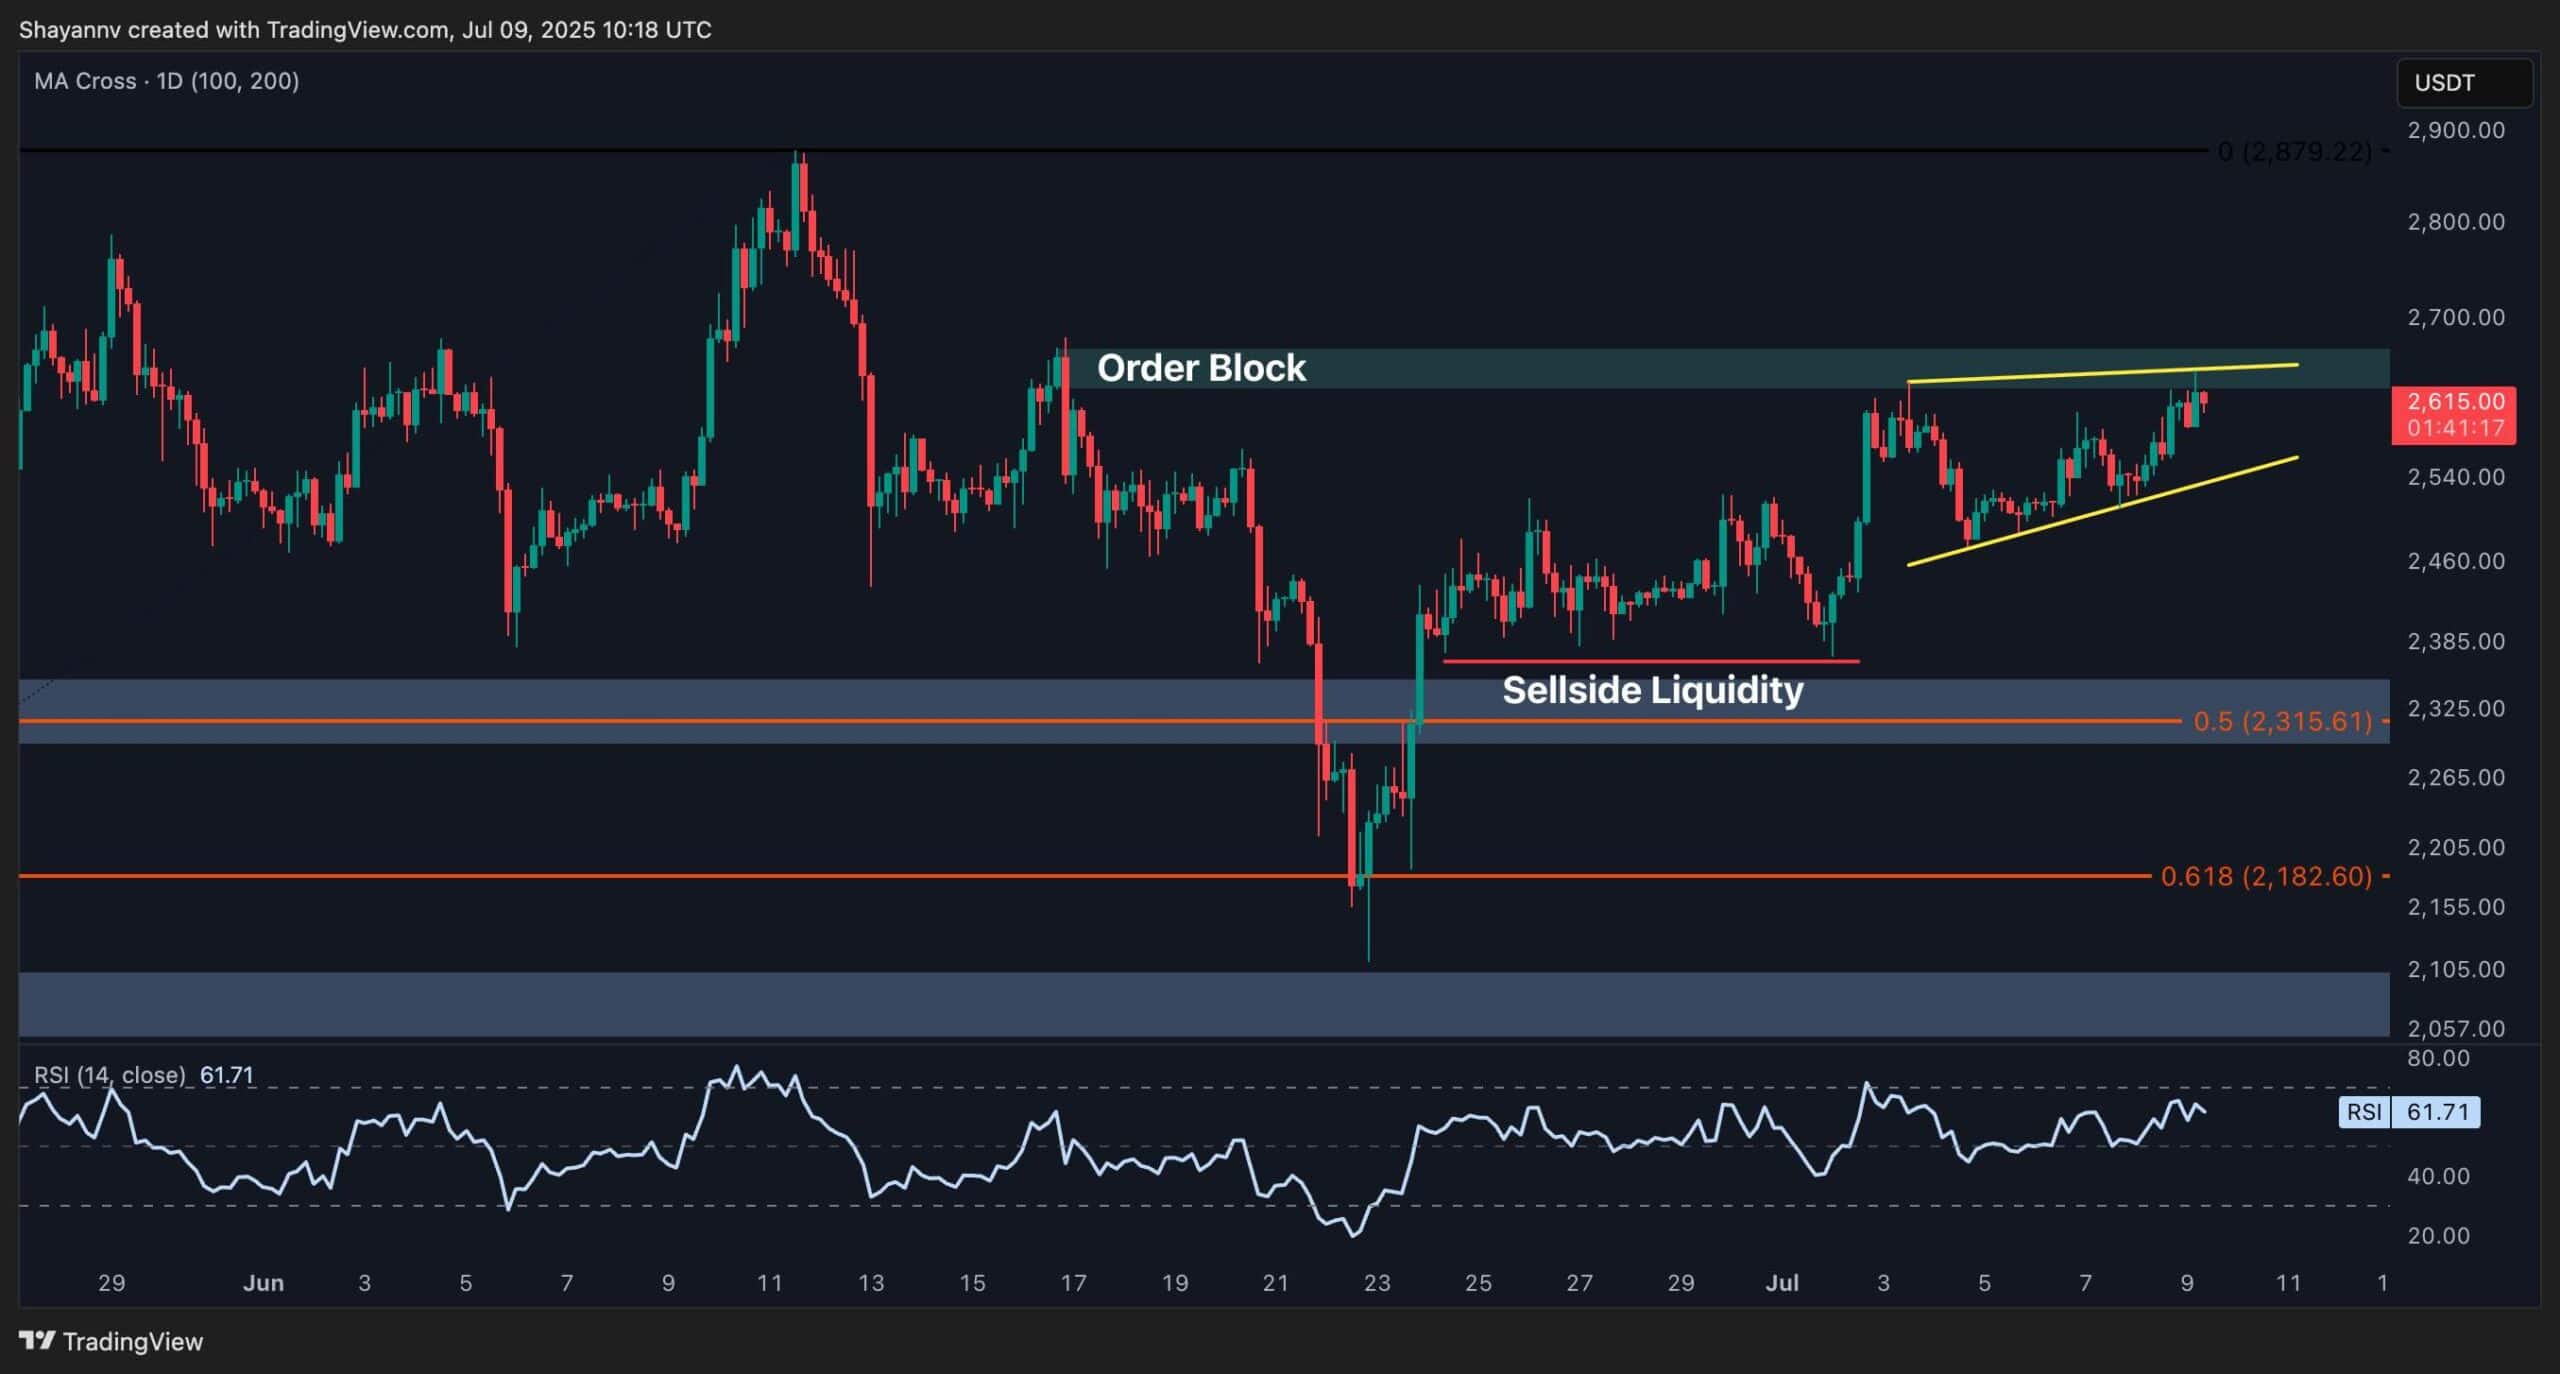
On-Chain Analysis
Ethereum Exchange Reserve
Ethereum’s on-chain data remains supportive. Exchange reserves have dropped to 18.93M, reaching one of the lowest levels in recent years. This indicates a continued trend of accumulation and self-custody, reducing the immediate sell pressure from centralized exchanges. Historically, such drops in exchange balances have coincided with bullish price phases, provided macro sentiment aligns.
Market sentiment has shifted slightly bullish, with ETH reclaiming its key moving averages and funding rates remaining neutral. However, the absence of explosive demand from retail or whales suggests that a breakout will likely require a catalyst, which can be in the form of a short liquidation cascade, to accompany the spot market demand and push the price higher in the short term.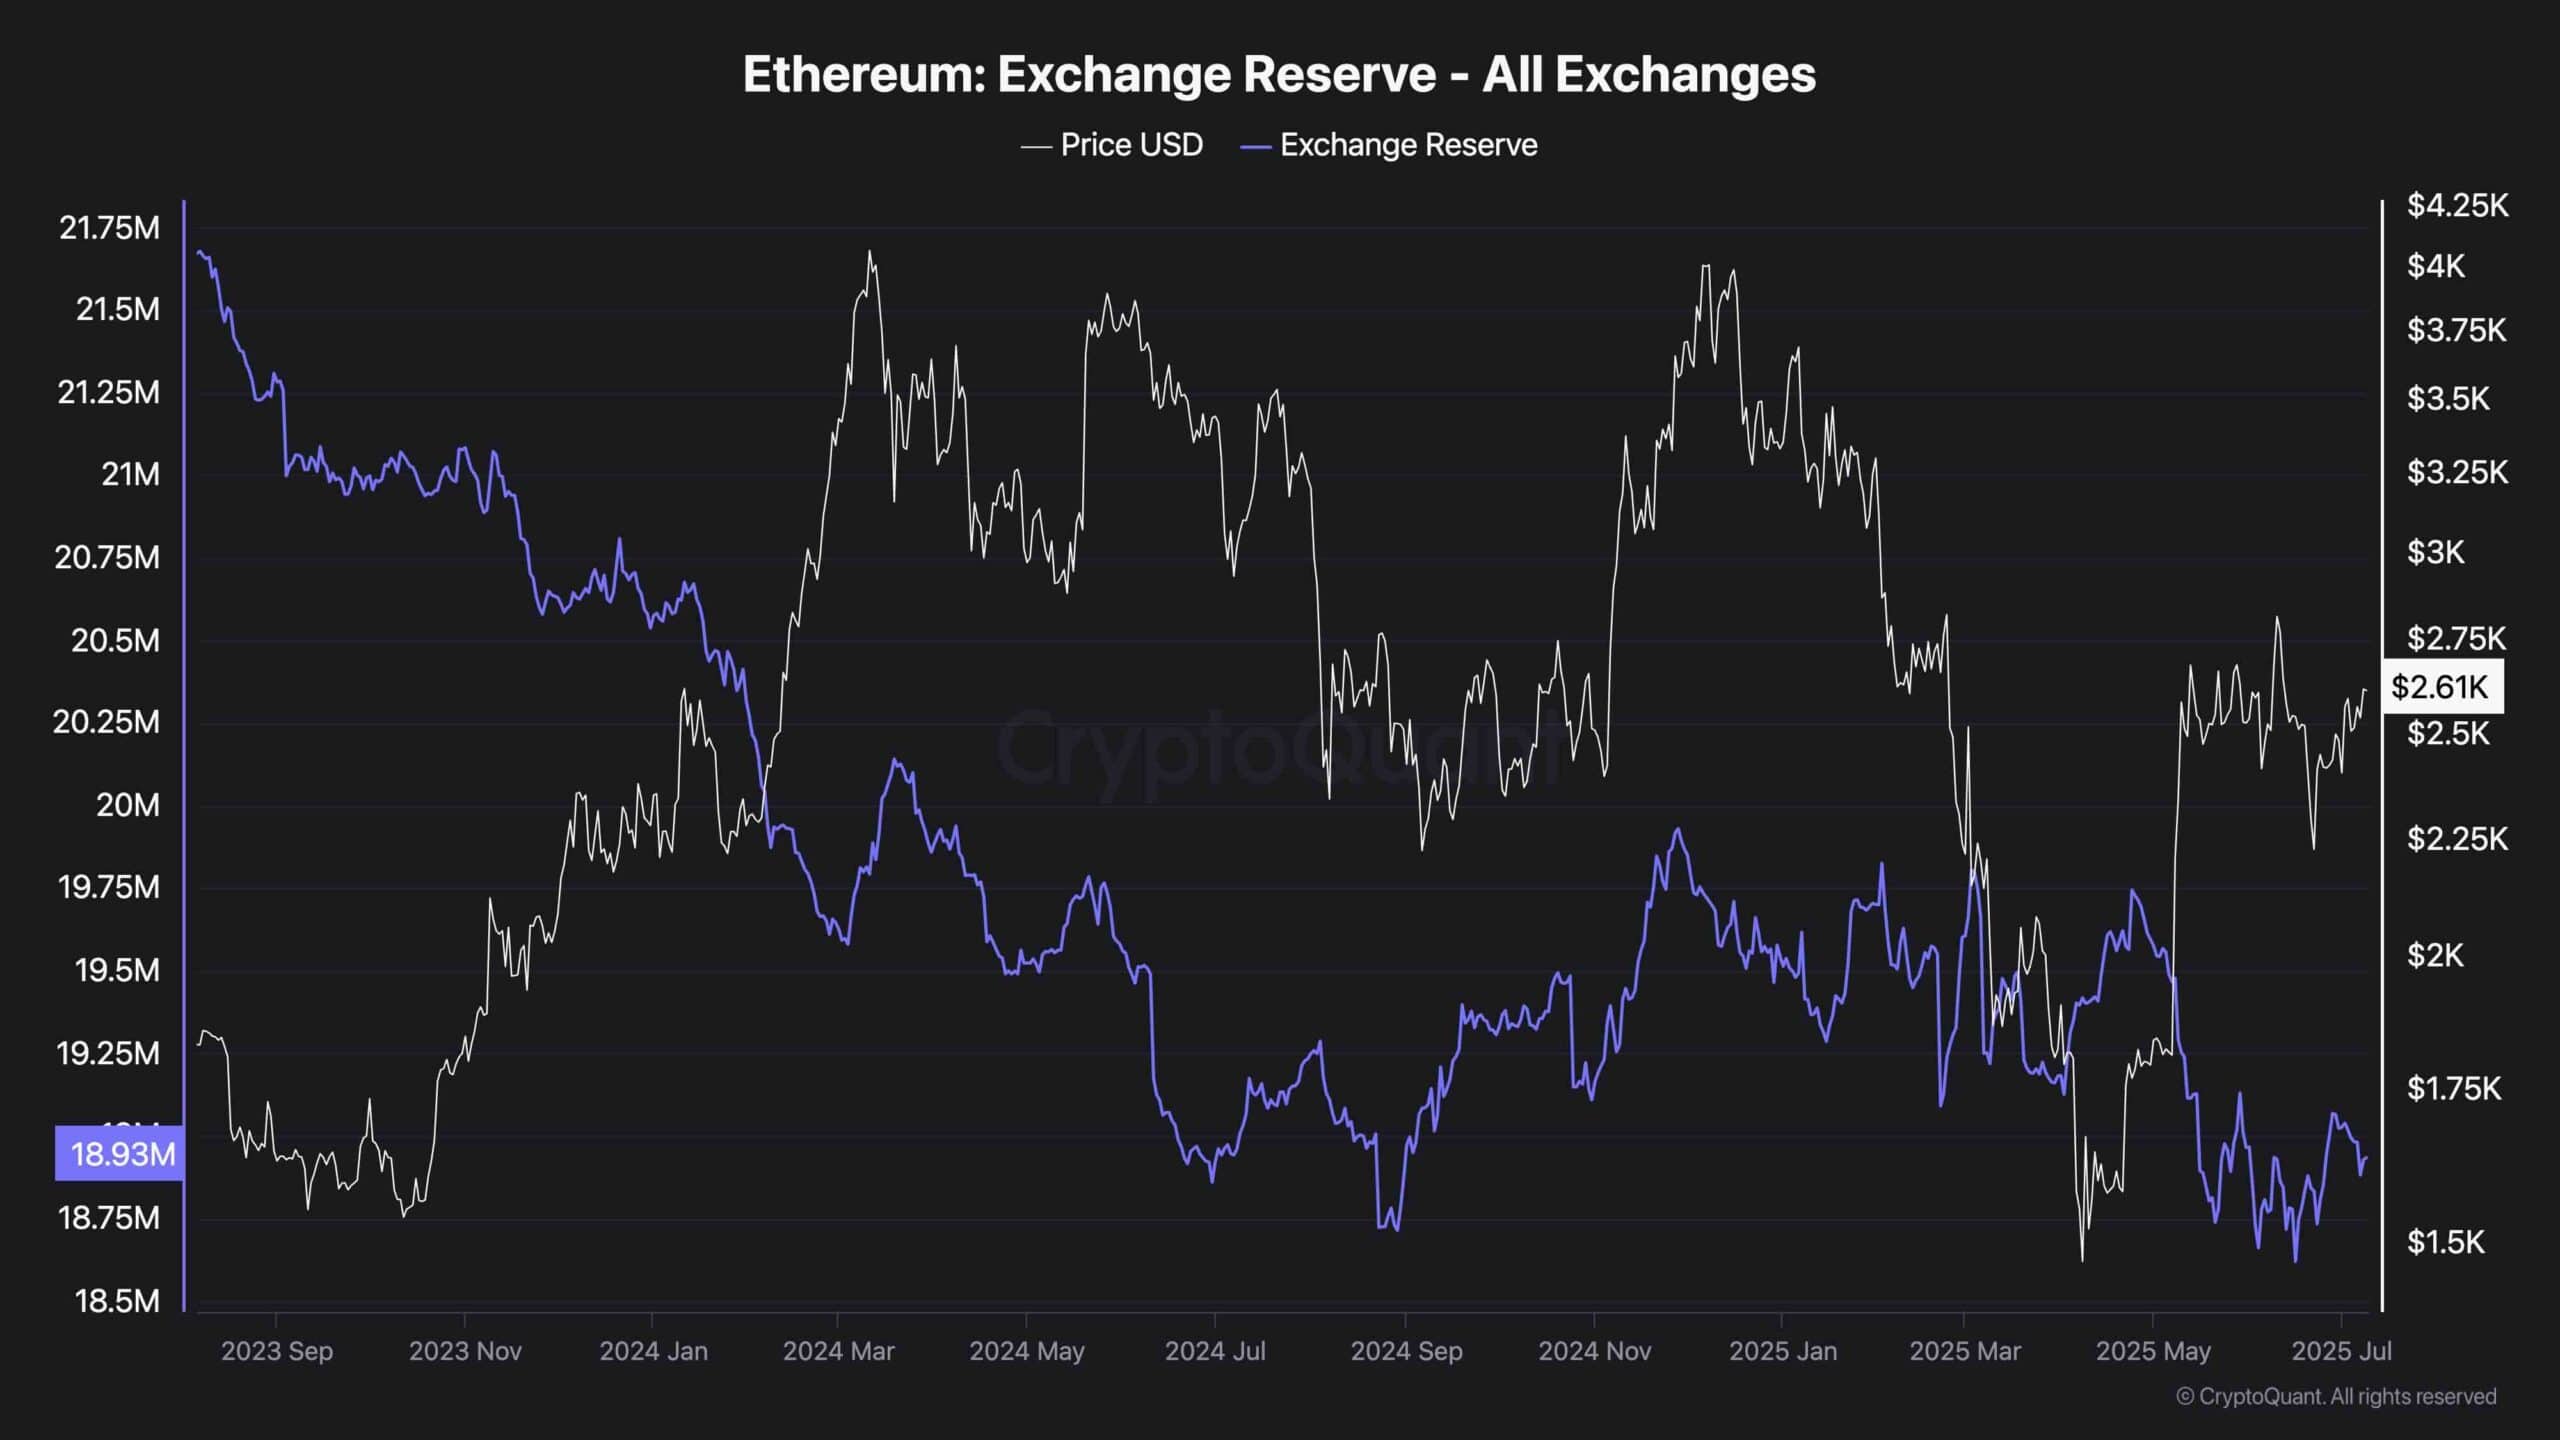
Binance Free $600 (CryptoPotato Exclusive): Use this link to register a new account and receive $600 exclusive welcome offer on Binance (full details).
LIMITED OFFER for CryptoPotato readers at Bybit: Use this link to register and open a $500 FREE position on any coin!
Disclaimer: Information found on CryptoPotato is those of writers quoted. It does not represent the opinions of CryptoPotato on whether to buy, sell, or hold any investments. You are advised to conduct your own research before making any investment decisions. Use provided information at your own risk. See Disclaimer for more information.
Cryptocurrency charts by TradingView.